Figure 1. Four stages in hypermedia designing (Kommers, 1998).
Chapter 1
Problem description and analysis
"A common mistake that people make when trying to design something completely foolproof is to underestimate the ingenuity of complete fools"
DOUGLAS ADAMSSection 1 of this chapter contains the description of the problems that Cantho University as well as students of the Department of Geography has to face. The chapter, then, continues with the analysis section. In this section an overview of the context at Geography Department such as the teacher and student characteristics, the curriculum, school facilities will be discussed.
Only a few decades ago it was still common that teachers at universities used the blackboard to write down course notes. Students had copied these notes from the blackboard. After text processor and photocopies entered the universities, many teachers created readers and distributed courses material themselves (Pras, 2001). These methods of teaching still being used in most schools in Vietnam nowadays. Together with "talk and chalk" teachers hand out the slides and readers for students. Actually, readers have some advantages at this moment. They are easily to be maintained or improved, low cost, convenient in using since they don’t require techniques insurance. However, the disadvantages seem more overweight. Firstly, the readers are not in the same level of content quality. Teachers at different universities hardly collaborated and readers produced at different universities looked quite different. Besides, the readers lack of animation, multi-media and interactive parts and facilities that can make teaching more productive and fun (Pras, 2001).
Additionally the problem relates to the results of information explosion. Since few decades ago, educators have to continue to call attention to the explosion of knowledge. To deal with the explosion, educators have 2 major problems that need to be considered: what knowledge to select and how to organize it (Ornstern & Hunkins, 1998). The knowledge selected should relate to the future and the knowledge organized should base on the new methods of teaching or on the modern technology application. Without multimedia technology application, teachers can’t manage to transfer effectively a huge amount of knowledge in such limit teaching time…
Next, government supports for educational development and students studying in School of Education don’t need to pay school fee. Therefore, radical increase of student population in Geography Department is nearly double in size comparing with 3 years ago. There fore, computer based teaching expected to help educational system and to allow a large number of student population receives the new learning quality of education.
Besides, budget for education and training in Vietnam increases from 15% of the total national budget in 2000 to 20% in 2010 (Government policy, 2000). This increase in budget as a decision stipulates the application of CBT firstly in the universities. This stipulation is seemingly to meet the needs of rapidly increasing student population and desires for a quality education for all citizens.
Moreover, ICT as a mean for helping students to develop the job skills necessary for this technological world and to meet the future economic needs. And the enormous importance and potential of WBI is to meet the educational challenges of preparing people to live in the society which is dominated by the computer. (Shlechter, 1991).
Finally, the WBI has developed and implemented within the force of hardware and software manufactories developing. These commercial interests have vigorously encouraged school system to use computers because they needed a huge market for their products (Shlechter, 1991).
In the view of these trends, the important problem in the context of Cantho University today is the need to expand the application of WBI in the new environment. Based on tremendous potentials that WBI can bring, the project named "Highly visualized and dynamic Cartography Web-based materials for Geography Department, Cantho University, Vietnam " is conducted as examples for applying web-based in teaching. Whether the project’s implementation is successful or failure relates not only to the quality itself, the instructional strategies, but also to the environmental context in which the project will be displayed. There fore, the analysis part of the learning context will be employed in next section.
1.2 Organizational context analysis
The learning environment is composed several factors that affect and are affected by the learning that take places: teachers, learners, instructional materials, instructional equipment, facilities, content and community.
There are 14 members in teaching staff of Geography Department. 3 of them are specialized doctorates, most of the rest have master degree in Geography and they have been working at least 10 years.
The course Cartography will be delivered for first year students. One lecturer and a teacher-assistance have responsibility for the course conveyed in theoretical and practical time as well.
Teachers in Geography Department have to do a very busy job with teaching at School of Education and many in-service classes in other provinces of Mekong delta. They also have to grade, prepare lesson or exercises, participate meeting, attend training courses… The tasks are many and vary, as a result, the more they do the less they have time to invest improving their computer skills. As a result, they are unlikely be able to make complex e-learning materials for their own. Web-based material, there fore, should be made not by individual but group of teachers sharing work together.
Based on these difficulties, although many conferences, workshops have been hold to introduce new methods, technology of multimedia application in teaching, teachers have less time to involve, hence, are not willing to change their traditional "chalk and talk" style of teaching. Many of them have no experiences in multimedia application and the school doesn’t supply enough instructional equipment (hardware, computer, tools, slide viewers, systems, video, projectors, electronic screen and so on).
Generally, there are some obstacles when developing and implementing CBI or ICT in Geography Department :
Ministry of Education and Training (MOET) consider the content of the Geography curricula relating to the geography context of Mekong Delta where the School takes place.
Students in Geography faculty have to complete the following courses:
Cartography is the core course that being taught for first year students. Content of subject relates to the basic physical geography. This helps students deepen understanding about the Earth shape and the ways to display the Earth phenomena by several means of maps, graphs, database or GIS (Geographic Information System)
Fundamental cartography includes 4 credits (60 hours) and designing thematic maps includes 3 credits (45 hours). Fundamental cartography gives students theoretical knowledge about history of cartography, characteristics of maps, map projections, types of thematic maps for education, map design, mapping methods and so on . Students can use some materials for group working to analyze the map display, calculate area, distortion, direction etc. Additionally, thematic maps design is the practical course that gives students chances to familiar with some map making software: MapInfo, ArcView, Microstation and AutoCAD CMAP.
The content of Cartography has some characteristics:
1.2.3 Analysis the instructional materials, classes and facilities
Beyond the rooms for studying theoretical sessions, Geography Department has 3 laboratory rooms for guiding practical activities. These are pedagogy room where students can train teaching, surveying and cartography application room and GIS (Geographic Information System) application room.
The computers, scanner and Microsoft compatible hardware are available for teachers. However students have to pay money for using computers in laboratories of the School.
Classes for theoretical session are usually very large with more than 100 seats. These large classes are still popular because Vietnam is an overpopulation country and financial problems don’t either allow School reconstruct nor hire a number of new teacher staff at the same time. Teaching theory in such a large class has disadvantage since teacher can’t pay enough attention to every student.
However classrooms are equipped moveable chairs, overhead, beamers, screens and so on. Teachers can create the cooperation learning climate where students can work in-group, share experiences, opinion and make representation. The department sufficiency meets the students’ requirements. School supplies enough materials for practical work, graphs, maps and a library where students can find out what teachers require reading.
The requirements for technology application in School are more than that. Technology is the root of ICT application that can decide whether the ICT application successfully or not. However School now faces several problems relate to the technology application.
The Web Cartography will be given to students who have passed the entrance examination to School of Education in social field of studies (literature, history and geography). Based on the results of the exam, Geography Department selects about 80 students each year among of 2000 applicators. It’s a sharp competition, however, students plan to study Geography usually in lack of scientific abilities. Actually, in Vietnam applied science courses would bring students more job opportunities or would promise higher promotion after graduation. Therefore, students who are talent in sciences will take the applied sciences course but the geography. As a result, students who study geography are usually in unwilling attitudes, ambiguous for the future job opportunities.
They are generally in age of 18-25 and are equally divided males and females. Few of them are from Cantho province where the school takes place and the rest from the different provinces of Mekong delta.
They have positive attitude toward the content of the subjects given. At the beginning of the course (first year), they felt more difficult due to different teaching methods of what they used to familiar in high school. Under pressure of finding good job, they diligently study and are high respectful in exam result. The higher results (grade) they get the better opportunities for them to find job in better schools.
Students in Geography department are more independent and less cooperative than those of in the other faculties. They seem more passives and less talent and deductive thinking comparing with students in science and technology. They are usually keep silent, unwilling to reveal ideas unless when they are forced to. They have good memory ability but less of creative and imaginative.
They vary in computer experiences. Some students have extremely limited experiences while the other are expert in using many software.
They are more joyful and eager in practical work than in theoretical one.
1.2.5 Implications
According to the learning environment characteristics, it’s can be seen that the implementation of CBI successfully under some demands:
From many obstacles drawing, the implementation WBT, CBT or ICT successfully in such context is not easy. The mission requires time, financial support and efforts of each person. This project together a visualized, interactive web site with good examples and prototypes of animation and simulation plays a very important role since it’s the first material in School to apply web based in teaching. It can be seen as the revolution of multimedia and technology application in teaching. This goal will be evaluated through empirical results of the outcomes. Therefore, we should highly consider about the quality of the web site in terms of its educational effectiveness to obtain the great teachers engagement.
Our department hasn’t had either ‘Blackboard’ nor ‘TeleTop system’. TeleTop and Blackboard are closed systems and they are not suitable for courseware designing purposes. But the normal tools for designing and engineering are good enough for our purposes in this phase. We prefer open systems.
Chapter 2
Design Approach
"In every walk with nature, one receives far more than he seeks"
ANONYMOUSThe design stage of the general systems approach contains a general plan that will guide the execution of an educational product’s creation. The design phase has 2 aspects, educational and functional. The educational component reflects the learning goals, content analysis, instructional strategies and level of interaction and evaluation procedures. The functional aspect, on the other hand, introduces software-related schemes, prototypes and diagrams.
This chapter explores the educational design aspects. Section 1 of the chapter consists of an overview introduction about the Web site as the new innovation for educational purpose. The section 2 continuously discusses the theory of instructional design process of the web site. Section 3 depicts the whole process of designing a Web-based material for instruction: Web Cartography.
Education is a field notorious for whimsy, and most innovations are not sustained very long. The notion of having students active engaged while learning (as opposed to passively listening or reading) is emerging with substantial research support (Ellis and Fouts, 1993). Because the web is a communication medium in which passivity is very possible (Brooks, 1998), in order to avoid that situation, we are seeking for the web site as an example of medium considering for the strategy of visualized, dynamical and interactive.
The research has three reciprocal relationships web sites:
The Web Cartography, a main site of the research, is made for teachers, in-campus and in-service students who use the web site like a book about instruction and technology. This chapter will discuss about instructional aspects. For instructional strategies the web-based materials contain two thrusts: description of what is possible on the web and identification of instructional strategies that are likely to be effectively (Brooks, 1998).
About the web site, firstly, this is not an online web course but a site of web-based materials that accompanies the textbooks of cartography provides a dynamical environment for demonstrating many of the principles set out in the text of the books.
Secondly, the web site holds colored versions of illustration given in the books, animation, simulation, relevant dynamic and interactive maps to demonstrate functionality discussed in the books
2.1.1 Geography department desired the web site
2.1.2 Advantages of the web site
It would bring opportunities for
2.2 Background of designing web-based materials
Confucius had it right. A picture can convey a wealth of meaning comparable to thousand of words. Today, via computer technology, we can create a rich environment of color, shapes, sounds and words. More importantly, that technology also provides the resources to construct a ‘microworld’ (Towne,1995). The model not only allow us to view some aspects of the world in a convenient manner, it also can respond to our actions upon it in ways that are appropriate to our level of understanding (Towne,1995). This section will discuss how to make such models with which students can learn, practice and explore.
In the beginning of designing process, it’s helpful to follow the 4 stages in designing educational hyper- and web-media mentioned by Kommers. The four stages should be performed sequentially after each other, without backtracking or iterations (Kommers, 1998).
The designing process starts by the conceptual design
Conceptual design is about the imagination of the idea product. It has to do with the generation of good ideas and its implementation. Conceptual design is the brainstorming for the first ideas of the Web site. The following mind maps is the result of the conceptual design process.
The research has three major divisions (or three major web sites). The main topics of divisions (web sites) are listed and subdivisions of each topic are clearly shown.
Metaphoric design is the transition stage from the abstract ideas to the concrete recognizable form. On the metaphoric stage, the overall character of the multimedia application will be described. In other word, the metaphor selection decides if the program becomes "intuitive", and if the user spontaneously catches the meaning of the program. It saves complex instruction and pervasive misconception (Kommers, 1998).
In this stage the global structure of the program is identified. The whole program is divided into three layers that represented below:
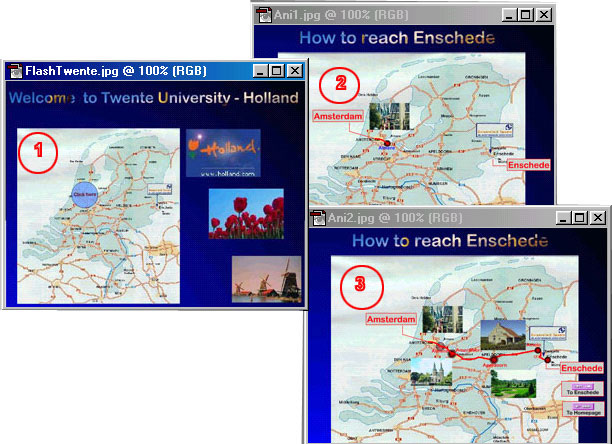
The introduction page is the homepage of the program in which the map of Vietnam and some beautiful landscape pictures are designed. Those pictures are chosen because they meaningfully describe the content of geography course - cartography. They can attract students and motivate them deeper explore inside.
Homepage gives the general navigation to the three division sites: Geography Department Organization, Web-Cartography, and Web-Cartography Prototype. Click the button on the map then it links to the specific site. The sites are classified in further branches subdivisions are introduced.
Navigation design is anticipation to the routes by the user. In order to provide the users with an optimal balance between freedom and complexity, it is important for designer to ask himself: Where should I place a certain piece of information? Or which links should be make in order to provoke a certain effect at the user. (Kommers, 1998). Navigation design consists of strategies how to motivate student to the interactive environment. From that points, animations, simulation, virtual reality (VR) or interactive should come to account.
2.3 Instructional strategy decisions
The success of a multimedia application rather depends on the instructional design chosen than on the media or technology employed (Fenrich, 1997). The choice of multimedia does not determine the learning, however, influence the amount of instructional process. In order to obtain certainly efficiency in applying multimedia in instruction, designers should consider the issues such as interaction, adaptive learning, visual imagery, and effective communication (Tetiwat & Igbaria, 2000). Web-Cartography is produced to support geography students an interactive learning environment. It should contain some specifications.
Information of the web site will be delivered in chunks. These chunks should fit to the screen. Chunks can be used to focus the reader’s attention to specific information. On other way, chunks can help designers create interaction by clicking the bookmarks given on the top of the pages to link them to the specific content below.
The content of Web-Cartography strongly relates to the textbooks and curriculum. Additionally, applying animation, simulation, and virtual reality (VR) arises largely to deal with real world processes. And spatial data animations from the interactive maps can depict change in space (position), in place (attribute) or in time (Kraak, & Ormeling, 1996) of the real world.
Interactive and dynamical maps, projections, images will be used as examples to motivate students, provide them with easier understanding, observatory tasks and inspire them to formulate their own opinion.
Practice is delivered by means of assignments. Students can self-test and self evaluate their understanding. They can also self improve their observatory skills, micro worlds, skills of interpretations and judgements.
Designing reliable web-based material is not trivial. The system should allow students flexibly navigate through the web site and ensure that all the materials are presented in a right way. In addition, designing a web-based material for instruction requires special considerations that are media selection (dimensions), input devices, question/feedback writing and interactivity.
2.4.1 Media selection (dimensions)
In order to support learning more effectively, well-designed web site should be diverse multimedia resources rather than dominated a single one. The media mix can include text, sound, and graphics.
Text support excellent instruction to teach most skills: intellectual, cognitive, verbal information and attitudes (Fenrich, 1997). For Web-based course to be effective, the text has to be understandable, readable. It should be developed in a good writing styles and should follow the basic rules of writing.
Type families (fonts) of the text include Serif fonts (Courier, Garamond, Times New Roman) and Sans Serif fonts (Arial, Haettenschweller, Verdana, Lucida, Tahoma). For printed materials, Serif fonts are more preferable since they have feet at the base of each character that help the eye move horizontally. For those characteristics, they were chosen for writing headings. On the other hand, Sans Serif fonts are clear, simple, and easily readable. That the reason we prefer choosing Sans Serif fonts for our Web site.
Music as a component of audio, will be used for homepage for introduction of the site. Music can set to change mood feelings, learning atmosphere and stimulate students’ emotions.
Before export to the Flash files, music should be covered in 24 bit, 22 kHz. In Flash, you can use sound-editing controls or Action Script to change the volume, change the point at which music start or stop playing or set how many times the music will repeat.
Graphics, images, pictures, maps are very important in design this web site. They can be used to illustrate concepts and present information in effective ways. Some concepts are extremely difficult to explain without graphics. Maps are the essential tools of teaching Geography and Cartography. Maps, as images, on our Web course were taken by scanning Le Grand Atlas, publish by DeBoeck Wesmael (1989)
The greatest consideration when aiding maps, graphics is it needs the large file size. File size decides how long wait for graphics to download and display. Why sometimes a large graphic can download quicker than a smaller one? Yes, it relates to the compression technique process.
There are 2 main graphic file formats used on the web: GIF (Graphic Interchange Format) and JPEG (Joint Photographic Experts Group).
GIF uses index color (for 8-bit monitor, 256 colors or less). GIF use RLE (run-length encoding) compression, hence, it’s best for full tints (graphs, maps, drawings) and it supports transparency. JPEG uses full color, flexible, customizable, "lossy" compression and it uses best for graduated tones (photo’s).
Where GIF images will look identical on 8-bit or 24-bit monitor. JPEG will look better on a 24-bit monitor and not so good on 8-bit.
It’s possible to produce small files with JPEG than with GIF. On 8-bit screens, GIF images, maps tend to look better than JPEG but on 16-bit or 24-bit it’s worse.
For that reasons, we considered which file extension should be chosen to save every picture or map on the Web. The target of these choices is limit the file size but still keep the quality of the pictures, images or maps.
Multimedia should be designed to be simple and easy to handle. The simplicity can keep the program user-friendly and to maintain motivation and interest. As every computer has both keyboard and mouse attached, which are used as input devices.
Keyboard will be used to write down the answers, observations or comments. Since written text is an important function in the instructional multimedia application, keyboards are the first choice of input devices. Progressively, keyboard input allows students respond with short or long answer and can help them to build up the minimum requirement of writing skills. On the other hand, mouse can help students navigate through the learning program easily. They are relatively inexpensive resources and most computer have mouse attached.
Any other theoretically possible input devices like touch-screen or voice input neither necessary nor practical, there for, they are not in-need to attached to the computer of the target group.
2.4.3 Asking questions and getting feedback
In multimedia application for instruction, questions are used to reinforce learning, evaluate understanding, help students to apply learning to problems and to keep students actively involved in learning (Fenrich, 1997)
For this Web-based course instruction, we use some different types of questions: Text input, check box, radio button for multiple choice, filling blank, true-false and essay test.
Provision feedback is an important element in instructional strategy. Feedback should be provided in explaining, immediate and positive ways. It is necessary to visually display the learners’ answers and the explanation feedback parallel next together.
All along, as Anonymous said ‘in every walk with nature, one receives far more than he seeks’. Interactivity in instructional features, as strategy, can help students themselves "walk with nature". Trustfully, according to Fenrich, interactivity in instructional strategies is to promote active learning and to provide critical support for increases in all educational activities. For this purpose, we produce web-based material with animations, interactive maps, VR, simulation models to promote students observing, learning, practicing and discovering.
Animation means to give life to something (Fenrich, 1997) and it is to indicate a sequence of drawing or graph images stitched together to form a movie (Brooks, 1997)
Animation (parallel with music) was used to design the homepage of this Web site. In this application, it can gain attention and show relationship between objects and ideas. In addition, some other animation models in the Web site was used to attract students, improve learning or motivate their attitudes. Animation can also be used to explain the abstract concepts. Animation on the Web site are also samples or maps with blinking symbols to attract attention to a certain location.
For Cartographer, the demand for animation arises largely from the need to deal with real world processes as a whole, rather than single time-slices (Carwright, Peterson, & Gartner, 1999). Cartographic animation is about change, change of geospatial data components of location, thematic attribute and time (Ogao, 2002). Spatial data animations in Web maps can depict change in space (position) in place (attribute) or in time that the paper (static) maps can not do. Animation can be used to display several Geographic phenomena. It can show the relationship of changing spatial data to time, such as changing temperature per month, deforestation (or urbanization) per 5 years etc.
When studying animation for this Web site, we used following techniques:
From terminology, interactive and dynamic maps are defined
Interactive or dynamic maps (variables) are particularly interesting in an interactive display environment, where users can "play" with the variables to discover patterns, relationships and trends. It has several benefits for instruction:
Maps that used to make interactive and dynamic were taken from several sources:
Figure 18 (chapter 3) shows the possibilities of ArcView GIS application. ArcView can select data from tabular tables to create charts, graphs, layout for a map and so on.
The complicated files from ArcView or other GIS tools are exported to Adobe PhotoShop or Freehand to select layers, convert and interpolate thematic layer and then export to Flash to make the movies. The smaller or simpler files from GIS tools can be exported directly to Flash. Figure 5 depicts the process.
VR can totally immerse in artificial or simulated environments, yet the participants retain the feeling of experiencing a real environment (Fenrich, 1997)
For Cartography studying, VR "world" can provide freedom of movement and combination with other media such as animations, sound, and imagery to enrich map‘s reading and attraction.
Although most VR applications provide entertainment rather than instruction, they still have some incredible instructional potentials, for instance
On the web site, we use Virtual Reality Modeling Language (VRML) to provide a 3D-map example. Figure 19 (chapter 3) shows the VR view of Enschede station (Tran, 2002).
Model provides students a complexity of the real screen. It enrich the learning environment, allow students understand 3D-spatial relationship among several objects. In addition, it provides them more interactive activities. Students can optimize the viewpoint to see which screen they like or operate the movement by the sensor. As the result, the more students know about the object being display, the more they readily can form.
Today, Cartography is changing to new types of displaying maps. From the traditional maps, view-only maps or scanned images maps to interactive, dynamic, animated, and Virtual world, Visual exploration maps and multimedia maps. They are different each other as following:
From those kinds of maps, we can see that Virtual World maps are the combination of static, dynamic and animated maps. These types of maps offer students environment to interact, operate the viewpoints, turn over, zoom in zoom out, span maps over the screen
Software used to create VR module in the program is: CosmoWorld
Simulation is the use of a model to conduct experiments which convey an understanding of the behavior of the system modeled (Gogg & Mott, 1993). Instructional simulations allow students to learn by manipulating on-screen models in ways that resemble real-world interactions. Simulations can respond immediately to display the consequences of learner decisions (Fenrich,1997)
Simulation mostly has animation output or "growing" graphs as output.
Simulations can be used in a large teaching environment. They can teach many, diverse subjects, such as: law of supply and demand, psychology of students’ behavior and attitudes, diagnose illness, environment, deforestation management, urban planning etc.
Instructional simulations are efficiently used to teach when there are difficulties with real situations such as: dangers, difficulty of repeating, expense, lack of available or inconvenience.
However, sometimes students may not believe the results of a simulations and they feel trouble to explain the results of the simulation or transferring the knowledge to real situation (Fenrich, 1997)
In order to limit these troubles, the effective simulation application should convey some aspects (Fenrich, 1997)
Today computer simulation, as a educational tools, is a form of learning in which the user may experiment with a simulated situation (Min, 2002). It enables students to make decisions without running great risks and can offer the teachers possibilities to provide experimentation with the subject matter in a ordered way (Min, 2002). In order to make distinction between simulation and modelling*, Hinton, 1978 stated: ’A simulation allows the students to control input parameters and observe the output. The model, usually in the form of a mathematical relationship, it set up within the computer program and the student can simulate the phenomena or process by controlling the input and observing the output. In modelling the student is able to control or change the model upon which the simulation is based’.
For special model-driven simulations** in educational web sites, Min (1996-2002) has developed a simulation system for using in open systems based on applets. We have experiments with this system in a course ‘Technology and Simulation’. Our applet was called ‘AORTA’. It was a simulation environment about medical phenomena.
In this project we have developed two prototypes and studied them
Techniques to build animations and simulations will be discussed in the next chapter.
Chapter 3
Technical Approach
Multimedia learning combines several technologies: some simple and some more complex. Traditional books, audiotapes, lectures and training video are still used, but they face competition from new materials being produced on CD-ROM and disk-interactive media. Makers of these products suggest that well-designed multimedia demands more action, involvement, and attention from students and instructor than do traditional methods. According to the Interactive Multimedia Association, this type of interactive training can result in learning gains up to 50% greater than traditional methods consisting of lecture and one-way video alone (Boland, 1996).
To a greater extend, designing an effective multimedia application firstly based on the functional aspects of technology. In view of these trends, this chapter will introduces an overview about the world wide web and internet, discuss the software-related schemes in session one. And the session two discusses technique and programming languages in relation to designing models, prototypes, examples and diagrams on the Web-based material.
The web has evolved as a graphical way of viewing information over the internet. Documents called web pages are collected in web sites stored in various computers connected to the internet. Web pages contain text as well as multimedia elements such as pictures, sound, video and animation. These items integrated using Hypertext Markup Language (HTML) in a way to facilitate communication over the network. Web pages are viewed with software programs called browsers. Several better known browsers are Netscape Navigator and Microsoft Internet Explorer (Rea, White, McHaney & Sanchez, 2000).
Normally, when a web browser looks up on a location, the so-called Uniform Resource Locator (URL), the following happens. First the computer contacts the Web server with URL that typed in by the client to "get" information from a specific address HTTP (HyperText Transfer Protocol). The Web server looks at the filename requested by the computer and then sends that file back. The server will "put’ the request HTML file to the clients system. The client’s browser will "visualize" the requested HTML file.
The internet allows also intranets, that are private networks and protected content mostly of companies, schools or universities. Internet connects through a route and the connections are identified 32 bit addresses
For example: ‘Kartoweb’ is a computer within the intranet of International Institute for Aerospace Survey and Earth Sciences (ITC). ITC is a computer within the intranet Surfnet. Surfnet is computer connected to the internet. The connection can be seen in the figure 7.
Web pages mostly contain fields, forms, elements and components. Elements are such things as pictures, audio fragments or (linear) animations. Components are 'intelligent' elements, that contains programmed interactions and/or 'smart' output. Applets are components. Forms are series or fields and fields are small places in a form where the user can type input or can read output.
For moving parts (as animations or simulation) designers needs tools. For other elements or for more complex animations or simulation designers always need a programming language as JavaScript, Java, DHTML or ActionScript. These languages are especially for dynamical and intelligent parts of animation, simulation or micro worlds.
There are a lot of tools that used for designing this Web-based instructional material for Cartography, such as:
There are special tools for storage geographic spatial databases:
For animation we used:
To understand what is possible with these tools, designer needs more information from 'performance research'. Performance research is testing systems, tools or programming languages on respons time(s), calculation time(s) and/or ‘moving’ time(s) for objects to move from point A to point B on a screen. Therefore, researchers or designers build small prototypes and do tests to find the performance, the ‘power’ of systems, tools or languages in practice.
Obviously, more than before teachers and web-designers need to know how things are accomplished on the www so to be able to design good materials. Today, with the development of computer applications tools, teachers have more jobs to do. They have extraordinary media resources to be learned to create individual files. Among of the resources or technologies applied in designing web course, we focus on which can make animations, simulations to create interactive and effective learning effects for instruction.
HTML (Hypertext Markup Language) is the major language of the internet's world wide web. Web sites and web pages are always written in HTML. With HTML and the web, we have the ability to bring together text, pictures, sounds, and links... all in one place. HTML files are plain text files, so they can be composed and edited on any type of computer... Windows, Macintosh, Sun, whatever.
HTML is only important as concrete between elements, (building) blocks and/or components. HTML doesn’t allow calculating formulas or mathematical models. We need JavaScript or Java for calculations as necessary in 'smart' of 'intelligent' interactive animations. But with JavaScript we can not make movies, dynamic graphs or animations.
There are some good tools for animation. But they are not good for everything. Tools have restrictions if animation objects are driven by formulas, model or are driven by interactions (or interventions) of the user. So designer needs languages as Java, DHTML or ActionScript (in Flash) for such animations.
ActionScript is important to develop such dynamic parts on web sites. If we want to have intelligent parts in animation or simulation we always need programming or scripting languages
Flash is a tool for animation. Animations with flash are mostly linear animations. The term for this kind of animation is 'frame-by-frame’ animation or animation in which bitmapped objects move from one place to other on the screen. In figure 8 you can see an example. A Flash file can be used as an element in a web site. If a designer likes more intelligent animations or a simulation with Flash, he uses the internal script language ActionScript. In figure 13 you can find an example of a combination of ActionScript with a lot of intelligent and/or interactive moving objects.
Java is an internet web programming language that can be used to create special effects as animation or graphical output on www pages. Java was introduced by Sun Microsystems in 1995 to create new interactive dynamical possibilities on the www and - since then - has been accepted by all major operating systems developers (IBM, Microsoft and others).
With Java, it is possible for calculating positions of objects in animations and moving one or more objects at the same time, with high speed, through the screen. Additionally, Java has evolved into much more: software developers can build small applications, called 'applets'. Sometimes applets are not small but complex. Mostly applets are called components and can be used in www pages.
Most applets are complicated. Designers don’t always like applets because it costs lots of time to build them and programming is time-consuming. In that case designers like to use libraries or building blocks. Building blocks are Java applets, built by special companies or departments of universities. Java applets are designed in Java. The source code in Java is compiled with a compiler into a class-file. The class-file can be translated by the browser and it causes interactive animations, calculations, or other tasks. We have used the JdK-compiler of Sun computers. (JdK is the trademark of Sun computers.)
At the University of Twente the group of Min, Sikken and de Goeijen have developed a very special library with a lot of applets for students and researchers. That is the library 'WebLib'. For simulations the university has developed a special library 'SimLib' (Min, 2002).
Java applets from 'WebLib' and 'SimLib' are easy to use in combination with HTML and JavaScript. With these components in combination with normal programming tools for HTML and JavaScript, you can build beautiful visualized and dynamical web sites for e Learning environments.
We have studied a lot of animation and simulation methods and techniques around JavaScript, Java templates and building blocks. Because these are the basics for model driven animation, some of them are interested to apply for this thesis.
Figure 9. Example of a simple dynamical animation of angles and vectors build with Java (Min & Tran, 2002). The calculation part and the drawing part are programmed in Java in the applet.
A part of the source code in Java of the example in figure 9, is showed here:
{
  init();
  arad=2*3.14*a/360;
  Vx = S * Math.sin(arad);
  Vy = S * Math.cos(arad);
  Si = (int) S;
  Vxi = (int) Vx;
  Vyi = (int) Vy;
  g.drawLine(50, 350, 50,     350);
  g.drawLine(50, 350, 50+Vxi, 350-Vyi);
  g.drawLine(50, 350, 50,     350);
  g.drawLine(50, 350, 50+Vxi, 350);
  g.drawLine(50, 350, 50,     350);
  g.drawLine(50, 350, 50,     350-Vyi);
  g.drawLine(50, 350, 50,     350);
}
Java is language that can not be interpreted from a browser. Only the class-files, with the compilated Java code, can be interpreted by a browser like Netscape of Internet Explorer.
Here we discuss the theoretical background of JavaScript and its implication in practice.
JavaScript code is situated in an HTML document just like the HTML tags. The HTML code is situated between the tags <body>…</body>. The JavaScript scripts falls between the tags <script>…</script>.
JavaScript is language that will be interpreted from Netscape. It is somewhat similar in capability to, for instance, to Visual Basic.
JavaScript is used in web sites, to do such things as:
Figure 10 shows an example of JavaScript in our web site. We know that color is an important issue in map design. Students should consider which color to be chosen for the background of the map and the text on it. It based on the map topic, mapping methods, scales, level of generalization and so on.
Move the mouse on this picture, background color of the web page will be change. Students can chose which color for the background and the text are fixed on each other.
Figure 10. Possibilities of background and foreground color on the map.
JavaScript and Java are similar in some ways but fundamentally different in others. The table 1 shows their characteristics and differences.
Table 1. Differences between JavaScript and Java
|
JavaScript |
Java |
|
Interpret code on the client. |
Compile codes are on the server. |
|
Object- oriented. |
Object-oriented. |
|
Codes integrated with, and embedded in the HTML-file. |
Applets distinct from HTML but the name of the class-file (of the applet) is declared in the HTML-file. |
|
Variable data types not declared (loose typing). |
Variable data types must be declared (strong typing). |
|
Dynamic binding. |
Static binding (normally). |
Model-driven animations or simulations need calculations. JavaScript has a good performance for calculation formulas and models. However, JavaScript is only important for animation if the designer uses this beautiful 'performance' in combination with applets. The reason is that the graphical output part is just so important as the calculation parts. In section 3.2.3 we described the calculation in the applet themselves. In section 3.2.5 we describe applets without a calculation part. So the techniques of JavaScript in combination to Java applets was more important for our study.
3.2.5 JavaScript and Java-applets
JavaScript in combination to Java applets (and/or libraries with class-files) is an important technique for animation and simulation in e-Learning environments. In our study we developed a lot of prototypes to test the performance of all kinds of combinations.
These techniques allow designers to combine the best from two different worlds: the commercial standardized applets and one simple HTML-file with scripts into it. The designer can develop his own mathematical model or formula in JavaScript in his HTML-file. The animation part can be delivered by a company or a university group. This technique is used and implemented in a lot of experimental web pages of my web-site with the course I have built for my faculty in Vietnam.
This is an example of a JavaScript listing that depends on example in figure 11. You see a simple calculation of one of the vectors in the figure. This vector is based on a distance (S=88.04) and an angle (a=83.15). The applet presents the vector (from Vxi=11 to Vyi=87).
{
iii = document.formFrom.s1v.value;
S = parseFloat(iii);
jjj = document.formFrom.s2v.value;
a = parseFloat(jjj);
arad=2*3.14*a/360;
Vx = S * Math.sin(arad);
Vy = S * Math.cos(arad);
Vxi = Math.round(Vx);
Vyi = Math.round(Vy);
document.vector.setGrafiek1XY1(0,0); //point 1
document.vector.setGrafiek1XY2(Vxi,0); //point 2
document.vector.setGrafiek1XY1(0,0); //point 1
document.vector.setGrafiek1XY2(Vxi,Vyi); //point 2
document.vector.setGrafiek1XY1(0,0); //point 1
document.vector.setGrafiek1XY2(0,Vyi); //point 2
}
Figure11. Example of an interactive animation with JavaScript and a building block from 'WebLib' (Min & Tran, 2002). There are two sliders; each slider is an 'instances' of the class-file 'slider.class'. Furthermore two instances from 'Teller.class' with counters and one applet with visual output. The applet 'grafiekXYP.class' display the grid, the colors and the vectors. The lengths of the lines are calculated in JavaScript (in the HTML-file). There are 5 objects on this screen and three applets are involved. The class-files are the applets.
Figure 12. An example of a Java applet in combination with JavaScript. In JavaScript, designer can put the data as the position and the coordinates (Tran & Min, 2002).
3.2.6 ActionScript in Flash
ActionScript, the scripting language of Macromedia Flash, allows creating smart parts of animation that behaves exactly as we want. ActionScript can consist of a single action, such as play or stop action. It also can be a series of actions, first giving the conditions and then performing the action. We need the basics control for simple actions and programming languages for more complicated.
The basic actions let us control the playhead in the time line or link a new web page into the window. Basic actions include goto a frame or scence, play or stop actions, and getURL.
To create complex interactive programs for the Web site, we need some extended techniques.
In this thesis, we apply some basic scripting of ActionScript for many actions to create function for interactive maps as follow:
If a designer want to make more complicated and realistic model-driven animations or simulations for learning environments as described before, he need the local script language ActionScript. With ActionScript the designer can build the smart parts of his animation. In figure 14 you can see one aspect of an example of the language. In this example, ActionScript can make the map interactive. Setting properties of ActionScript can change the content map by switch on or off information on the map.
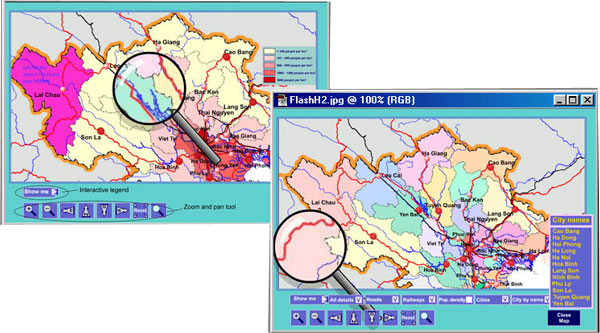
Figure 14. ActionScript allows making smart parts of animation to create interactive maps (Tran, 2002).
Figure 15 shows an example scripting language of ActionScript in Flash to zoom the map.
DHTML is the opponent of Java. Microsoft have developed this language to opposite Sun Computers. DHTML is a scripting language; Java isn't. DHTML is developed for drawing and animating objects on web pages. JavaScript can't be used for animation. So the combination of DHTML and JavaScript (in the HTML-file) is an important issue for this thesis. The DHTML script falls, just as the JavaScript, between the tags <script>…</script>. DHTML has to be used in combination with JavaScript and HTML, so it is an important technique for designers in schools or universities. Java is more for professional designers and companies. The sources of DHTML are open for the public. In contrasts, the sources of Java are secret, not open for the public and protected.
In our study we have developed one prototype to test the performance of this important language (in combination with cartography).
From the figure 16, you can see an example of DHTML animation driven in time by a sinus and cosines-formula. The calculation output drives the moving objects.
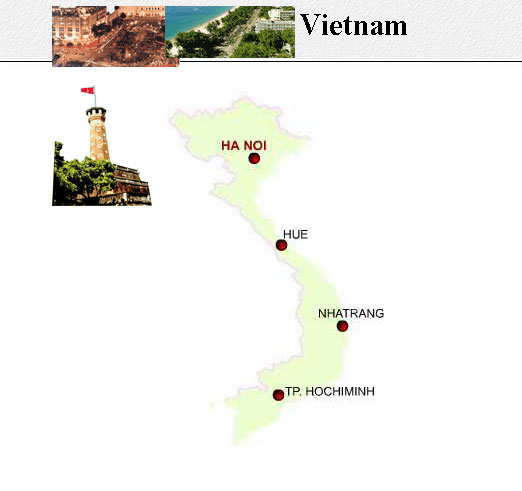
Figure 16. An example of DHTML with 4 bitmap files, 3 of them (the landscape pictures) are the moving objects driven by sinus and cosines formulas.
ArcView , as the other software packages such as MapInfo, Microstation, CAD etc, is the most popular desktop geographic information system (GIS) software programs. GIS is a database that link information to location (it connects what to the where), allowing people to see and analyze data in new and useful ways. The main application of these tools allows users to view and perform analytical operations on the data in the databases.
Most cartographic animation or interaction is compiled using bitmap graphics. ArcView or the other cartographic tools are used to select, convert (from vector to raster) and interpolate the needed thematic themes or layer files. Then the files will be exported to Flash to add animation or interactivity.
With ArcView, you can quickly locate geographic features, obtain information about features and control how data displays. In ArcView GIS, most data is stored in theme attribute tables. The figure 17 shows that the users can select the records from the attribute table, make the statistics from the records and create the charts (graphs) to show the records. Then they can display sorts of documents on layout. Layout is the final product of an ArcView project.
Map files from ArcView are exported to Freehand, PhotoShop to select layers, convert and interpolate thematic layers and then exported to Flash to make movies.
Flash can make animated, dynamic and interactive maps. These kinds of maps can help users see the cartographic objects changing in space (position), in place (attribute) or in time. The figure shows the interactive map using ArcView and Flash. This is an interactive (or clickable) map. Students can click to find more information, go through or explore information themselves.
Figure 18. An example of a map, designed by ArcView and used here in combination with Flash. By ActionScript (the internal scripting language of Flash), the map becomes interactive and dynamical (Tran, 2002).
Virtual Reality Modeling Language (VRML) version 1.0 was in practice in October of 1994. This is a 3D format developed by Silicon Graphics. VRML 2.0 adopted in March 1996 provided a much greater level of interaction (Cartwright, Peterson, & Gartner, 1999). Besides, VRML 2.0 can provide enhancements like animated textures and sound, objects could move or be moved.
The building blocks of VRML are called nodes. The most basic nodes describe geometric primitives – shapes like boxes, cones or cylinders. In addition, there are some more functions such as group shapes, define viewpoints and lighting, control animation, detect collisions and sense user input.
VRML, object-oriented programming, is possible to create event-driven world that combines objects with behaviors.
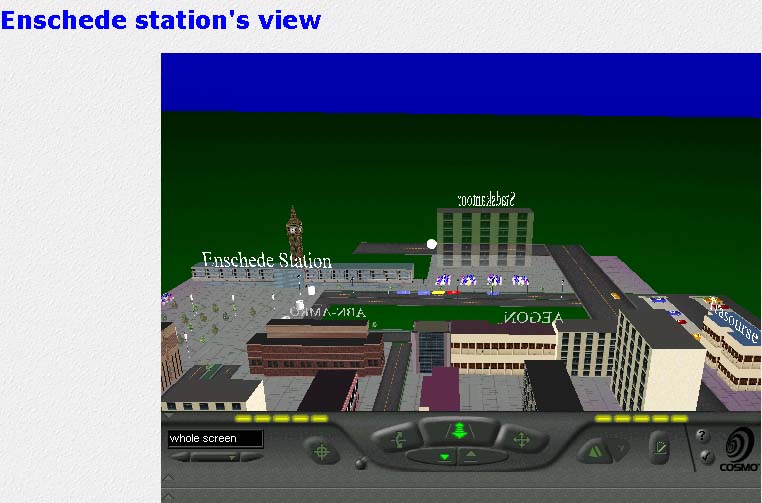
Figure 19. An example of animating prism map ‘Enschede Station’ using Cosmo Worlds VRML plug-in. It appears as a 3D perspective maps. The set of nodes defined the shapes and behavior of the prism. The behavior relates to animation (moving cars, buses) which can control by external ‘touch sensor’ node. The map scene can be manipulated or selected by the ‘viewpoint’ function in the toolbar (Tran, 2002).
In VRML, messages are coordinated through a technique called "wiring". This is a interactive "circuit" built by wiring nodes together. The nodes receive actions then send to other nodes via the wire.
More complex actions in VRML can be built by VRML’s scripting that written in either Sun’s Java programming language or Netscape’s JavaScript.
The software that is used to create a VRML Prism map ‘Enschede Station’ in the thesis is Cosmo Worlds. The prism map as an example of VRML is a statistical surface map viewed in perspective. Dot, choropleth maps are common kinds of statistical maps. They are presented in 2D and can be designed to 3D mapping based on their attributes.
Chapter 4
Evaluation
This chapter will discuss the design issues of the evaluation procedure. It provides an overview introduction of evaluation process, respondents group characteristics, the applied instruments, the data collection approach, the results of evaluation data analysis and a summarize of the completed survey.
Evaluation is an important element of the instructional progress. Evaluation should be conducted before, during and after implementation in order to receive valuable comments for strength or weakness of the web material. Since the web site hasn’t either implemented in real context yet and nor absolutely completed. It’s still on the progress of improvement, the evaluation stage, therefore, just focuses on formative.
Formative evaluation is an integral part of the development process. According to Flagg (1990) formative evaluation is to inform the decision-making process during the design, production, and implementation stages of an educational program with the purpose of improving the program.
Formative evaluation is a checking process during and at the end of the development of instructional materials. For planing formative evaluation, Flagg (1990) stated some general questions to obtain the right information, like:
The Flagg’s state is the guideline for our evaluation process of the web site. The main purpose of this evaluation is to collect and analyze information about the content and the implementation to improve the quality and effectiveness of the instruction. To achieve this aim, the evaluation questions should be conducted in the proper way. To do that, we suggest some criteria for evaluation aspects of the web site: usefulness, validity of the content, effectiveness in instruction and media functionality. We will translate these questions into simple statements to make it easier for respondents’ evaluation.
There are two groups of respondents in this evaluation. Fist group is the 7 instructors of ISM Department TO Faculty, Twente University and of Geography Department, Cantho University. They are teachers, content experts, technology experts or in other different field. The second are 11 Twente University and ITC students participants. They are different in their background, age, sex and so on. The characteristics of the respondents can be summarized in the table 2.
Table 2. Characteristics of two respondents group
|
Characteristics |
Instructors (teachers, experts) group |
Students (users) group |
|
Number |
7 |
11 |
|
Scientific degree |
|
|
|
Working experiences |
|
|
|
Professional background |
- Focus on teaching and lecturing. |
|
4.3 Evaluation methods and instruments
In the setting of formative evaluation, the two kinds of questionnaires were used to collect data: one for experts (teachers) and one for students.
During the development phase of the program design circle, expert evaluation should be conducted very early. The purpose is to allow avoiding possible mistakes at the early of the program and to ensure that the final materials offered to students would be qualified. For our project, a variety of experts were invited: subject matter, instructional design, and media experts. Their activities in formative evaluation process can be described as following.
Conducted at the beginning of the development phase of the design circle. Subject matter experts review materials for content accuracy, significance, up to day, verified and comprehensiveness.
Conducted at the last month of the development phase. Design experts evaluate the materials for good instructional quality, tasks and exercises.
Conducted at the beginning of the development phase. Media experts assess the technical production quality of the materials. They examine the qualities of the techniques, the appropriateness of the lighting, sound, animations, simulations, interactivity, the efficiency of the computer programming, and so forth.
In order to help our material accomplish the quality, as we want to, we suggested inviting 7 experts for formative evaluation. They are instructors of Twente and Cantho University and are in different specialists. This allows us to conduct a questionnaire based on following issues: course content, instructional strategies and media functionality.
The questionnaire designed for experts consists of 24 items (see table 3) and 2 open-ended questions. For answering the 24 items, the experts were asked to mark their expression from positive to negative by scaling. For open-ended questions, they were asked to indicate strong and weak points of the web site and to give their suggestions for improving the web site. The answering form of expert questionnaires can be seen in appendix 1.
The expert questionnaire contains following evaluation aspects: course content, instructional strategies and media functionality.
Table 3. Expert questionnaire evaluation.
|
Course content evaluation
|
|
Teaching and learning strategies |
|
Media functionality 24. The web site is not boring and has a good layout. |
Student evaluation is important in development phase in design circle. The purpose of this process is that it provides an opportunity for gathering in-depth information of the course.
For this evaluation, instead of gathering answers from geography students in Vietnam, we conducted evaluation in Twente University and ITC in Enschede, Netherlands. The questionnaire was administrated 11 Master students in TO faculty and in geo-information science of ITC Institute. They are invited to answer 20 closed question items. In additionally, the last 4 questions those are open-ended questions asking for recommendations. The answers to the questions were to be chosen from 5 point scales ranging from absolutely agree (number 1) to absolutely disagree (number 5).
The goal of the questionnaire was gathering information regarding to the objectives of written materials of the course, course content, usefulness, effectiveness of the course, the easiness of site visit, learning activities, the way of the course implemented, extend of possibilities and satisfactory with what they have learned from the course.
In the questionnaire, there are some characteristics of the web site should be discussed in this evaluation:
The questionnaire also contains open-ended questions by which students are asked to write general impression about the web site, indicate positive and negative sides of the site and give suggestion or recommendation to the site.
Questionnaire form is presented on the table 4. The full questionnaire format is attached from appendix 2.
Table 4. Student questionnaire evaluation.
|
Usefulness of the web site
2. The web-based material can support self-study, distance learning and activities outside the classroom.
|
|
Content of the web site |
|
Functionality of the web site |
4.4 Evaluation procedure
The evaluation was conducted in the period of 1st August to 15th August, 2002. The questionnaires were sent to the group of teachers and students in Twente and ITC. After the questionnaire being filled they were collected within 2 weeks after sending. The example of filling questionnaire can be found in appendix 3.
The gathering of evaluation data was used for further analysis and summary.
4.5 Data analysis
Based on the data collected from the expert and the student questionnaires, we analyze the results according to the group of respondents: experts or students.
4.5.1 Expert data analysis
Summary the data from the expert questionnaire is presented in table 5. The first column in the table indicates the number of statements (items) of the expert questionnaire (see table 5). The other columns show the numbers of answers for positive and negative expression in each statement. The answers are categorized by the content of the site, instructional strategies and media functionality. The last column shows the mean of the calculated number of the measured items.
|
||||||||
|
|
|
|
|||||
|
|
|
|
|
|
|
||
|
|
|
|
|
||||
|
|
|
|
|
|
|||
|
|
|
|
|
||||
|
|
|
|
|
|
|||
|
|
|
|
|
||||
|
|
|
|
|||||
|
|
|||||||
|
||||||||
|
|
|
|
|||||
|
|
|
|
|
||||
|
|
|
|
|
|
|||
|
|
|
|
|
|
|
||
|
|
|
|
|||||
|
|
|
|
|
||||
|
|
|
|
|||||
|
|
|
|
|||||
|
|
|
|
|||||
|
|
|
|
|
||||
|
|
|
|
|
||||
|
|
|||||||
|
||||||||
|
|
|
|
|
|
|||
|
|
|
|
|
||||
|
|
|
|
|
||||
|
|
|
|
|
||||
|
|
|
|
|
|
|||
|
|
|
||||||
|
|
|||||||
Table 6. The total average score of the expert evaluation
|
Mean of content evaluation |
|
Number of this evaluation is calculated by statistics methods, in which:
M: Mean per question
MP: Mean of each part
FM: Final mean
Nr: Number of experts invited for evaluation.
Nq: Number of questions.
Np: Number of parts.
4.5.2 Student data analysis
Similarly, the data collected from the student evaluation was summarized. The results presented in the table 7. First column labels the number of the items in questionnaire. The content of the table indicates the number of answers (positive and negative) in each particular statement in the questionnaire.
Results of student evaluation
|
||||||||
|
|
|
|
|||||
|
|
|
|
|||||
|
|
|
|
|||||
|
|
|
|
|
||||
|
|
|
|
|
||||
|
|
|
|
|
||||
|
|
|||||||
|
||||||||
|
|
|
|
|
||||
|
|
|
|
|||||
|
|
|
|
|
||||
|
|
|
|
|
|
|||
|
|
|
|
|
||||
|
|
|
|
|
||||
|
|
|
|
|
||||
|
|
|
|
|||||
|
|
|
|
|
||||
|
|
|||||||
|
||||||||
|
|
|
|
|
||||
|
|
|
|
|
||||
|
|
|
|
|
||||
|
|
|
|
|
|
|||
|
|
|
|
|
||||
|
|
|
|
|
||||
|
|
|||||||
Table 8 shows the final mean score of the items, which have been answered by students.
Table 8. The final mean score of the student evaluation
|
Mean of each part |
|
|
Mean of functionality evaluation |
1.90 |
|
Final mean (FM) |
1.76 |
4.6 Discussion
4.6.1 Expert evaluation discussion
4.6.2 Student evaluation discussion
The evaluation conducted in the ITC, Twente University, Netherlands instead of in Cantho University, Vietnam where the project would be implemented. As a result, the scientific background of student group respondents is different and differs to that of geography students in Vietnam, there fore, the results may lead to bias. We should accept the gaps and inconsistency in data collected with what we expected. Additionally, due to the limited time for evaluation process we are only allowed to invite small group of responses. Those leads to the results collected were not significant enough. For further study, we should consider about these issues.
However, regarding to the responses of the experts and students for what to improve the web site we greatly considerate and appreciate. Their ideas mostly are very interesting, valuable. These should be carried out and accomplished in the next version.
Conclusion and recommendations
On the Need Assessment phase, the overview investigation was conducted and revealed the learning environment context of CTU and Geography Department. In one hand, the problem characterized the deficiency of computer knowledge, skills and performance of instructors and students in application computer technologies in instructional process. Additionally, the other problem should be come to account and considered is the insufficiency of facilities, computer labs in school. On the other hand, school is also under pressure for the change, the pressure of growing information technologies in education. School needs new standards of education and possibilities for improvement education quality. That is the reason web-based course material is designed, developed and implemented. The site can be used as a complementary tool during the face to face teaching, to support self-study, in-service education and distance learning (in the future). It can adapt the need of a wider student audience, flexibility for learning, more practical-oriented learning environment.
The Design phase contains a general plan that will guide the execution of an educational production’s creation. This phase consists of examine and analysis the instructional models and theories. The learning goals, content analysis, instructional strategies and the level of interactivity of the web site are also discussed. The web site consists of three sub reciprocal relationship web sites:
The elaboration of the project was continued on the Development phase. The outcome of the development phase was the blueprint of the course content. In this phase we also mentioned the functional aspects of technology to create the site. In this point, we discuss about the software, tools, scripting languages that are used to design the assignments, models, prototypes, and examples on the site. All of these efforts are to make the web site highly visualized and dynamical. In the end of this phase we recognized that most of designers use tools for linear animations, but for more intelligent and important learning environment they need programming languages. We have proved that in the desire of creating practical-oriented, self-discovering or interactive learning activities, even Flash can not support enough. However, with the help of ActionScript in Flash, the problems seem to be carried out. There fore, besides Java, DHTML, ActionScript is important for web application designers.
The next step of the project was the Evaluation. The evaluation was conducted to find out the deficiencies of the content, usefulness, effectiveness, structure and the functionality of the web site. Two types of questionnaire were sent to expert and student group of respondents. The data was collected and analyzed. The evaluation shows the rather positive attitudes toward the site. They also agree the good quality and the great contribution of the animation, simulation, and interactivity to the instruction. This is a highly visualized and dynamical web-based material for teaching and learning cartography.
Generally, there are some recommendations for following improvement the web site, such as
All these suggestions will be considered in the development of the final version. The web-based training site of teaching Cartography for geography students in School of Education, CTU will be designed, developed in September, 2002 and implemented after that.
For further development, designer needs deeper analysis the target group and context to create the more feasible web site. He needs create the group collaboration throughout the course and also improve the content and assignments of the course in Vietnamese language.
However, the product is successfully implemented or not, thoughtfully, depends not only on what various perspectives it should be bring but also on what numerous strategies it should be follow. Those of change strategies require agreement, supports, investment, relationship, and interaction of individuals, groups and systems.
References Books and Articles:
Boland, A. (1996). Multimedia fortifies learning. Advertising Age’s Business Marketing, 81(1):20
Brooks, D. (1998). Web-Teaching. A guide to Designing Interactive Teaching for the World Wide Web. Plenum Press, New York and London.
Cartwright, W., Michael, P., & Gartner, G. (1999). Multimedia Cartography. Springer
Clarke, K. (1995). Second edition. Analytical and Computer Cartography. Prentice hall, Englewood Cliffs, New Jersey.
Collis, B., & Moonen, J. (2001). Flexible learning in a digital world. Kogan page.
Fenrich, P. (1997). Practical Guidelines for Creating Instructional Multimedia Applications. The Dryden Press, Harcourt Brace College Publishers.
Flagg, B. (1990). Formative evaluation for educational technologies. Hillsdale NJ: Lawrence Erlbaum Associates.
Foley, J., & Van Dam, A. (1984). Fundamentals of Interactive Computer Graphics. Addison-Wesley Publishing Company.
Gogg, T., & Mott, J. (1993). Improve quality and productivity with simulation. Palos Verdes, Calif. JMI Consulting Group.
Kommers, P., (1998). Four Stages in Designing Educational Hypermedia. Paper used in CC4 Course: Instrumentation for Instruction and Training.
Kraak, M., & Ormeling, F. (1996). Cartography Visualization of Spatial data. Addision Wesley Longman Limited.
Min, R. (2002). Methodology & Technology about Multimedia and Simulation. 25 Web-sites published on internet at location http://users.edte.utwente.nl/min/home/index.html
Min, R. (2002). Technology and Simulation. A course on internet at location
http://to-www.to.utwente.nl/TO/ism/course/sim/index.htmlMin, R. (1995). Simulation Technology and Parallelism in Learning Environments. Academic Book Center, De Lier. Online available on location
http://projects.edte.utwente.nl/pi/BookOgao, P. (2002). Exploratory Visualization Of Temporal Geospatial Data Using Animation. ITC Dissertation
Ornstein, C., & Hunkins, P. (1998). Curriculum foundations, Principles and Issues. Prentice Hall, Englewood Cliffs, New Jersey.
Pras, A.(2001). Sharing Telematics courses. The CANDLE project 1-4
Rea, A., White, D., McHaney, R., & Sanchez, C. (2000). Pedagogical Methodology in Virtual Course. In A. Aggarwal (Eds.) Web-Based Learning and Teaching Technologies: Opportunities and Challenges (pp. 136-154). Idea Group Publishing. Hershey USA, London UK.
Richard, E. (2001). Multimedia learning. Cambridge University Press.
Robinson, A. et all. (1995). Sixth edition. Elements of Cartography. John Wiley & Sons, Inc.
Scriven, M. (1974). Prose and Cons about Goal-free evaluation. Evaluation Comment, 3, 1-4
Shlechter, T. (1991). Problems and Promises of Computer-Based Training. In T. Shlechter, Promises, Promises, Promises: History and Foundations of Computer-Based Training (pp.1-16). Ablex Publishing Corporation Norwood, New Jersey.
Tetiwat, O., & Igbaria, M. (2000). Opportunities in Web-Based Teaching: The Future of Education. In A. Aggarwal (Eds.) Web-Based Learning and Teaching Technologies: Opportunities and Challenges (pp. 17-32). Idea Group Publishing. Hershey USA, London UK
Towne,D (1995). Learning and Instruction in Simulation Environments. Educational Technology Publications Englewood Cliffs, New Jersey.
Willis, J., Hovey,L., & Hovey, K. (1987). Computer Simulations. A Source Book to Learning in a Electronic Environment. Garland Publishing, inc. New York and London.
Web documents:
Animation-Central (2001). Online available: http://www.freegraphicland.com
Webteacher Software, LLC (2002). Online available: http://www.webteacher.com/
Online source for free buttons (2001). Online available: http://www.freebuttons.com/index.html
The Ultimate Webmaster Resource. Online available: http://www.321webmaster.com
Dodge, M. & Kitchin, R. (2002). Online available: http://www.mappingcyberspace.com/
Environmental Systems Research Institute, Inc.GIS education and training on the web. Online available: http://campus.esri.com/
International Institute for Aerospace Survey and Earth Science (ITC) (2002). Online available: http://kartoweb.itc.nl/webcartography/courses/basic/index.html
http://kartoweb.itc.nl/webcartography/webbook/index.htm http://kartoweb.itc.nl/webcartography/webmaps/classification.htmMin, R. (2002) Technology and Simulation. Online available:
http://to-www.to.utwente.nl/TO/ism/course/sim/index.html
Min, R. (2002) The electronic version of the book Simulation and Parallelism in Learning Environments. Online available: http://projects.edte.utwente.nl/pi/Book/
Appendices
Title: Highly visualized and dynamical Cartography Web-based materials for the Geography Department, Cantho University, Vietnam.
Your name: ……………………………….
Your background and scientific degree: Implementation and evaluation of educational media and web based learning material. ………………….
Current date: 31 July 2002……………………
I would like your help in updating and adding adequate information for this web site. Your answer and opinion will help me further improve the material. Please mark your response to the items on the following scales:
1: Strongly agree 2: Agree 3: Neutral 4: Disagree 5: Strongly disagree
Thus, 1 represents the most positive, 3 for neutral and 5 represents the most negative impression.
COURSE CONTENT EVALUATION
|
1. The course objectives are clear. |
4 |
|
2. The course content supports to the textbook information and appropriate to intended studying. |
2 |
|
3. The content is relevant and includes up-to-date information. |
1 |
|
4. The difficulty level of the course is acceptable/ normal/ appropriate. |
2 |
|
5. Sources of the information are clearly, so the contents are verified. |
1 |
|
6. The graphs/ charts/ maps are clearly labeled and easy to read. |
2 |
|
7. Animations, simulations, interactive maps can help teacher to explain the abstractive concepts of the course. |
1 |
|
|
|
|
8. The assignments are relevant to the content of the course. |
1 |
|
9. The level of difficulty of the assignments is acceptable. |
3 |
|
10. The web site contains varied forms of assignments. |
2 |
|
11. The feedback provided is immediate, sufficient and clear. |
3 |
|
12. The web-based material is useful as a complimentary tool during the face-to-face teaching. |
1 |
|
13. The web-based material can support self-study, distance learning and activities outside the classroom. |
3 |
|
14. Using web-based material in combination with the textbooks is better than just using printed materials. |
1 |
|
15. The web site contains variety of presentation tools: animations, simulations and interactivity. The framework offers real world and creates experimental learning. |
2 |
|
16. Animations/ simulations are attractive/qualified and motivate students. |
1 |
|
17. I find the web-based material sufficiently practical oriented. |
2 |
|
18. The web site allows students interaction and communication. |
4 |
|
|
|
|
19. It is easy to move around the web site with the help of links. |
3 |
|
20. The graphics, maps, text, and color used in the web site are in an adequate form and format. |
2 |
|
21. Animation, simulations, and interactivity download efficiently enough to keep students focused on the task. |
2 |
|
22. Animations, simulations, and interactive maps are attractive and reach the learning objectives. |
1 |
|
23. The structure of the web site is good. |
3 |
|
24. The web site is not boring and has a good layout. |
2 |
25. Please give indications about the strong and weak points of the web site.
Strong points: many illustrations, sound, pleasant colors, animations.
Weak points: Structure of menu’s (when you are in the ‘course’ part you still see the menu of the ‘organisation’ part on top of the screen). The bubbles that stick to the mousepointer are a bit irritating. An assignment that takes 90 minutes and appears suddenly should be shorter.
26. Do you have any suggestions to improve the web site?
Make the menu on the left of the screen less crowded. Maybe a few less moving elements (check for functionality). The part on technology (VRML, Java) seems to be a bit different from the other two parts. It is more about methods while the other parts are about content. This should be more clear to the user.
Expert questionnaire evaluation (2)
Title: Highly visualized and dynamical Cartography Web-based materials for the Geography Department, Cantho University, Vietnam.
Your name: ………………………………………………………….
Your background and scientific degree: AV designer
……………………………………………………………………………………….
Current date:… 5 August 02………………………………………
I would like your help in updating and adding adequate information for this web site. Your answer and opinion will help me further improve the material. Please mark your response to the items on the following scales:
1: Strongly agree 2: Agree 3: Neutral 4: Disagree 5: Strongly disagree
Thus, 1 represents the most positive, 3 for neutral and 5 represents the most negative impression.
|
1. The course objectives are clear. |
2 |
|
2. The course content supports to the textbook information and appropriate to intended studying. |
2 |
|
3. The content is relevant and includes up-to-date information. |
3 |
|
4. The difficulty level of the course is acceptable/ normal/ appropriate. |
3 |
|
5. Sources of the information are clearly, so the contents are verified. |
2 |
|
6. The graphs/ charts/ maps are clearly labeled and easy to read. |
2 |
|
7. Animations, simulations, interactive maps can help teacher to explain the abstractive concepts of the course. |
2 |
|
TEACHING AND LEARNING STRATEGIES |
|
|
8. The assignments are relevant to the content of the course. |
2 |
|
9. The level of difficulty of the assignments is acceptable. |
2 |
|
10. The web site contains varied forms of assignments. |
2 |
|
11. The feedback provided is immediate, sufficient and clear. |
2 |
|
12. The web-based material is useful as a complimentary tool during the face-to-face teaching. |
2 |
|
13. The web-based material can support self-study, distance learning and activities outside the classroom. |
2 |
|
14. Using web-based material in combination with the textbooks is better than just using printed materials. |
1 |
|
15. The web site contains variety of presentation tools: animations, simulations and interactivity. The framework offers real world and creates experimental learning. |
2 |
|
16. Animations/ simulations are attractive/qualified and motivate students. |
2 |
|
17. I find the web-based material sufficiently practical oriented. |
2 |
|
18. The web site allows students interaction and communication. |
2 |
|
19. It is easy to move around the web site with the help of links. |
2 |
|
20. The graphics, maps, text, and color used in the web site are in an adequate form and format. |
2 |
|
21. Animation, simulations, and interactivity download efficiently enough to keep students focused on the task. |
2 |
|
22. Animations, simulations, and interactive maps are attractive and reach the learning objectives. |
2 |
|
23. The structure of the web site is good. |
2 |
|
24. The web site is not boring and has a good layout. |
2 |
OPEN-ENDED QUESTIONS
25. Please give indications about the strong and weak points of the web site.
Strong points:
The site give a lot off information
Weak points:
The navigation is not always correct for example "home buttons".
26. Do you have any suggestions to improve the web site?
Expert questionnaire evaluation (3)
Title: Highly visualized and dynamical Cartography Web-based materials for the Geography Department, Cantho University, Vietnam.
Your name: ………………………………………………………………………….
Your background and scientific degree: …MSc in Science and Technology Dynamics.
Current date:…01-08-2002
I would like your help in updating and adding adequate information for this web site. Your answer and opinion will help me further improve the material. Please mark your response to the items on the following scales:
1: Strongly agree 2: Agree 3: Neutral 4: Disagree 5: Strongly disagree
Thus, 1 represents the most positive, 3 for neutral and 5 represents the most negative impression.
|
1. The course objectives are clear. |
1 |
|
2. The course content supports to the textbook information and appropriate to intended studying. |
2 |
|
3. The content is relevant and includes up-to-date information. |
2 |
|
4. The difficulty level of the course is acceptable/ normal/ appropriate. |
2 |
|
5. Sources of the information are clearly, so the contents are verified. |
2 |
|
6. The graphs/ charts/ maps are clearly labeled and easy to read. |
1 |
|
7. Animations, simulations, interactive maps can help teacher to explain the abstractive concepts of the course. |
1 |
|
TEACHING AND LEARNING STRATEGIES |
|
|
8. The assignments are relevant to the content of the course. |
1 |
|
9. The level of difficulty of the assignments is acceptable. |
2 |
|
10. The web site contains varied forms of assignments. |
3 |
|
11. The feedback provided is immediate, sufficient and clear. |
2 |
|
12. The web-based material is useful as a complimentary tool during the face-to-face teaching. |
1 |
|
13. The web-based material can support self-study, distance learning and activities outside the classroom. |
2 |
|
14. Using web-based material in combination with the textbooks is better than just using printed materials. |
1 |
|
15. The web site contains variety of presentation tools: animations, simulations and interactivity. The framework offers real world and creates experimental learning. |
2 |
|
16. Animations/ simulations are attractive/qualified and motivate students. |
1 |
|
17. I find the web-based material sufficient practical oriented. |
2 |
|
18. The web site allows students interaction and communication. |
2 |
|
19. It is easy to move around the web site with the help of links. |
1 |
|
20. The graphics, maps, text, and color used in the web site are in an adequate form and format. |
1 |
|
3 |
|
22. Animations, simulations, and interactive maps are attractive and reach the learning objectives. |
2 |
|
23. The structure of the web site is good. |
1 |
|
24. The web site is not boring and has a good layout. |
2 |
OPEN-ENDED QUESTIONS
25. Please give indications about the strong and weak points of the web site.
Weak points:
26. Do you have any suggestions to improve the web site?
Appendice 2: Student questionnaire evaluation (1)
Title: Highly visualized and dynamical Cartography Web-based materials for Geography Department, Cantho University, Vietnam.
Your name: ……
Your background and scientific degree: …Master of TO faculty ETSD
Current date:……25 – 7-2002
I would like your help in updating and adding adequate information for this web site. Your answer and opinion will help me further improve the materials. Please mark your response to the items on the following scales:
1: Strongly agree 2: Agree 3: Neutral 4: Disagree 5: Strongly disagree
Thus, 1 represents the most positive, 3 for neutral and 5 represents the most negative impression.
|
1. The web site is useful as a complimentary tool during the face-to-face teaching. |
1 |
|
2. The web-based material can support self-study, distance learning and activities outside the classroom. |
2 |
|
3. It’s easier for me to understand difficult concepts of the Cartography subject. |
2 |
|
4. Using web-based material in combination with the textbooks is better for me than just using printed materials. |
1 |
|
5. I find that animation/simulation/interactivity are attractive/ qualified and they motivate me to explore information more deeply. |
2 |
|
6. I think the content of the web site is relevant and includes up- to-day information. |
3 |
|
7. I like to use the animation/ simulation/ interactivity models to explore more information. I think they make the learning environment effective. |
2 |
|
8. The maps/ charts/ graphs are clearly labeled and easy for me to read. |
2 |
|
9. I will apply knowledge gained from the course during my studying. |
2 |
|
10. The difficulty level of the course is normal/appropriate. |
3 |
|
11. I find the orientation of the web-based material sufficiently practical oriented. |
2 |
|
12. The assignments performed in the course are interesting and motivating. |
2 |
|
13. The feedback provided was sufficient and clear. |
2 |
|
14. The level of difficulty of the assignment is acceptable. |
3 |
|
15. It is easy to move around the web site with the help of links. |
3 |
|
16. The graphics and maps used in the web site are in an adequate form and format. |
2 |
|
17. Animation, simulation and interactivity download efficiently enough to keep me focussed on the task. |
2 |
|
18. Animations, simulations, interactive maps are attractive and reach the learning objectives. |
2 |
|
19. The structure of the web site is good. |
2 |
|
20. The web site is not boring and has a good layout. |
3 |
OPEN-ENDED QUESTIONS
21. What did you like most of all in the web site (course) …………
Obviously the technology support for the course and the closed relation as well as the interaction between them
22. What didn’t you like in the web site (course)?
…Maybe some topics is not so interesting for me
23. What did you expect from the web site that you did not find?
……Maybe some necessary bookmarks could make it more convenient to navigate and to learn
24. Do you have any suggestions to improve the web site? (stick ü on the following statements)
Student questionnaire evaluation (2)
Title: Highly visualized and dynamical Cartography Web-based materials for Geography Department, Cantho University, Vietnam.
Your name: ………………………………………………………………………….
Your background and scientific degree: …Master of ETSD………………………………………
Current date:………………………………………………………………………
I would like you to updating and adding adequate information for this web site. Your answer and opinion will help me further improve the materials. Please mark your response to the items by 5 scales:
1: Strongly agree 2: Agree 3: Neutral 4: Disagree 5: Strongly disagree
Thus, 1 represents the most positive, 3 for the neutral and 5 represents the most negative impressive
|
1. The web site is useful as a complimentary tool during the face-to-face teaching. |
1 |
|
2. The web-based material can support self-study, distance learning and activities outside classroom. |
1 |
|
3. It’s easier for me to understand difficult concepts of the Cartography subject. |
1 |
|
4. Using web-based material in combination with the textbooks is better for me than just only using printed materials. |
1 |
|
5. I find that animation/simulation/interactivity are attractive/ qualified and they motivate me to deeper explore information. |
1 |
|
6. I think the content of the web site is relevant and up today information. |
1 |
|
7. I like to use the animation/ simulation/ interactivity models to explore more information. I think they make the learning environment effective. |
1 |
|
8. The maps/ charts/ graphs are clearly labeled and easy for me to read. |
2 |
|
9. I will apply knowledge gained from the course during my studying. |
1 |
|
10. The difficulty level of the course is normal/appropriate. |
1 |
|
11. I find the web-based material sufficient practical oriented. |
1 |
|
12. The assignments performed in the course are interesting and motivating. |
1 |
|
13. The feedback provided was sufficient and clear. |
2 |
|
14. The level of difficulty of the assignment is acceptable. |
1 |
|
15. It is easy to move around the web site with help of links is good. |
2 |
|
16. The graphics, maps used in the web site are in an adequate form and format. |
1 |
|
17. Animation, simulation, interactivity download efficiently enough to keep me on task. |
1 |
|
18. Animations, simulations, interactive maps are attractive and reach the learning objectives. |
1 |
|
19. The structure of the web site is good. |
1 |
|
20. Web site is not boring and has good layout. |
1 |
OPEN-ENDED QUESTIONS
The overall structure and layout of the web site are nicely arranged. The web-based course makes the study more direct, interesting and effective.
22. What didn’t you like in the web site (course)
…It would be much easier for the students to use the web site if there is a icon of "back" in every page, both on the top and at the bottom. And I don’t think it’s necessary to put a piece of music at the beginning of the course.
23. What do you expect from the web site but it was not?
…The web site is very well developed and the contents are appropriate arranged. I am not an expert in Cartography, so I can’t say exactly what I expect from the web-based course.
24. What do you have any suggestions to improve the web site? (marking the following statements)
Student questionnaire evaluation (3)
Title: Highly visualized and dynamical Cartography Web-based materials for the Geography Department, Cantho University, Vietnam.
Your name:
Your background and scientific degree:…Engineer Cartographer
…………………………………….
Current date:…25 July 2002………………………………………
I would like your help in updating and adding adequate information for this web site. Your answer and opinion will help me further improve the materials. Please mark your response to the items on the following scales:
1: Strongly agree 2: Agree 3: Neutral 4: Disagree 5: Strongly disagree
Thus, 1 represents the most positive, 3 for neutral and 5 represents the most negative impression
|
1. The web site is useful as a complimentary tool during the face-to-face teaching. |
1 |
|
2. The web-based material can support self-study, distance learning and activities outside the classroom. |
2 |
|
3. It’s easier for me to understand difficult concepts of the Cartography subject. |
1 |
|
4. Using web-based material in combination with the textbooks is better for me than just using printed materials. |
3 |
|
5. I find that animation/simulation/interactivity are attractive/ qualified and they motivate me to explore information more deeply. |
1 |
|
6. I think the content of the web site is relevant and includes up-to-day information. |
1 |
|
7. I like to use the animation/ simulation/ interactivity models to explore more information. I think they make the learning environment effective. |
1 |
|
8. The maps/ charts/ graphs are clearly labeled and easy for me to read. |
2 |
|
9. I will apply knowledge gained from the course during my studying. |
1 |
|
10. The difficulty level of the course is normal/appropriate. |
2 |
|
11. I find the orientation of the web-based material sufficiently practical oriented. |
2 |
|
12. The assignments performed in the course are interesting and motivating. |
1 |
|
13. The feedback provided was sufficient and clear. |
2 |
|
14. The level of difficulty of the assignment is acceptable. |
1 |
|
15. It is easy to move around the web site with the help of links. |
2 |
|
16. The graphics and maps used in the web site are in an adequate form and format. |
2 |
|
17. Animation, simulation, and interactivity download efficiently enough to keep me focused on the task. |
3 |
|
18. Animations, simulations, and interactive maps are attractive and reach the learning objectives. |
3 |
|
19. The structure of the web site is good. |
3 |
|
20. The web site is not boring and has a good layout. |
2 |
OPEN-ENDED QUESTIONS
The layout of main pages
22. What didn’t you like in the web site (course)?
The illustration of map types because most of them are scanned images in not so good quality
23. What did you expect from the web site that you did not find?
Explanation about the concept for map design
24. Do you have any suggestions to improve the web site? (stick ü the following statements)
Enschede, sept. 10, 2002