A general dynamic concept model to achieve a goal (a 'think model')
as occurs in managing, controlling, learning, communicating and designing
(An Interactive Scientific Paper, 'ISP', with an online to use simulation applet into the body.)
By Rik Min (still in process: still under discussion in a small group; no earlier publications).
Key-words: control systems; feedback, accumulation, accumulating systems, aiming, measuring, assessment, evaluation, models, quality control.
Summary
This article is about feedback systems and control engineering. Students of the faculty for Educational Science & Technology (TO) need a clear concept for a number of subjects in respect of the dynamic behaviour of control systems and other phenomena in their scientific practice. For many years we have had the OKT-model at the faculty for Educational Science & Technology. This is a kind of procedure that is actually a think model to design and achieve a goal. This article will try to bridge the gap between the world of designing and that of control engineering. It should also lead to a generally applicable dynamic think model in respect of design (an analogon). Besides this paper proposes that this far reaching concept model can also be used for other goals. Such think models can be used to acquire a better insight into dynamic behaviour when managing a company, when designing a product, when trying to achieve a communicative goal and when trying to learn something in a world where a large number of sources is offered. All systems that measure a certain value (level, quality and such like) which is compared to a certain starting or desired level have something important in common. Namely, in all these systems 'accumulation' occurs, and the 'controller' is only satisfied when a certain end level has been achieved. People go on designing, controlling, communicating and learning until a goal has been reached. The founder of this approach is Juran. He calls this 'quality control' (Juran, 1954 & 1962). The article below endeavours to create a general dynamic think model that can be used to achieve a goal, in particular a design goal. Since these models belong to control engineering this paper also discusses the possibilities which control engineering has to offer and the theo retical characteristics of control and/or feedback systems.
Control engineering I
Our society is full of control systems. There are feedback systems everywhere and control engineering is present everywhere: in the economy; in public administration; where there is communication and in biology as in all ecological systems. Control engineering is hardly known in social science and consequently not very popular. Control engineering originates in engineering science. This article will show that its concepts and ideas can be excellent tools to approach the concepts of management and control theoretically and with insight.
At the faculty for Educational Science & Technology, the subject 'system approaches in educational science' also deals with 'control paradigms'. This is done in very general terms but not in such a way that an understanding is created for this point of view nor does its usefulness become clear. Control paradigms are actually too limited a concept. That is why, in this article, an effort is made to approach dynamic phenomena through the schematics of control engineering.
When there is a better insight into general principles and specific dynamic behaviour, a social scientist , an economist an educational scientist or a designer will be able to work with more logic and insight.
In general, a feedback system looks like the one in figure 1. There is a 'primary process', (the controlling system) (B.S.), a 'feedback loop', a 'control equipment' (B.O.) and an exclusive indicated system to compare the difference between the measured value and the desired value. For the present we will call it a 'comparer' . Two comparable quantities are compared. The difference is called 'error' (or deviation). That 'error' should become as small as possible.; preferably zero. In such a system you can achieve something by setting yourself a target and seeing whether it is achieved or not. The time required to achieve that target is of importance; it tells you something about the properties and possibilities of the system in question.
Surroundings and interruptions; difference; result
Figure 1. The separate parts of a system: the 'controlled system' (B.S.), the feedback loop and the 'controlling body' (B.O.) (a.o. Kramer and De Smit, 1991). The feedback loop is clearly visible. The moment of evaluation is essential to vouchsafe the 'quality' of the 'product'. Without the feedback loop one could never make the product equivalent to (in respect of quality) the desired value. The result of the effort is measured. This is what control engineers call a measurement and feedback system.
The primary process can be a plant, a device, a car, a ship, an aeroplane a service company or a group of people who do something. If this primary process is not controlled, no feedback will be required to provide the 'controlling device' with information. We call this a feed-forward system. Elsewhere, the pros and cons of such systems - without a feedback loop - are (Min, 1999).
A feedback system can be self-controlled or controlled. We call the phenomena of automatic control, i.e. self control, mechanisms that do their job automatically, without any interference being required: homeostasis. The systems described here, self control is not really an option. The target is not 'included', but the target is set by 'something' or somebody else. We will give examples of both systems.
Examples of self-controlling systems (self regulatory):
Examples of the first can be all kinds of controlled, dynamic processes in the human body. Our body temperature for instance, is somehow kept constant by a control mechanism. Another example is the market. Supply and demand of a product is generally kept stable in actual practice. When prices fall supply will fall too; when supply increases prices will rise (again). A certain fluctuation around a nominal value is normal and inherent even to systems with self control.
Examples of control systems:
Examples of the second possibility, control or controlled systems, are when, for instance, we decide to start running instead of walking. So with walking there can be two aims. We can order our body for instance to run. We set a target, viz. to let our legs run - at a certain speed - (goal B). We can also decide simply to walk. That is an entirely different target (goal A). Pain can be a feedback mechanism that induces us to run less fast. A watch can also act as a feedback mechanism. For instance, if we think we're going to miss the train - which we can see on our watch - we decide to walk faster.
A second example is steering a ship or a car. We turn the wheel for as long as it takes to make the turning. The eye of the man behind the wheel acts as the measuring instrument that provides the feedback. On a ship, however, the 'time constant' is much higher than in a car.
A third example is the design and manufacturing of a product. We set ourselves a target, a quality, and try to achieve that goal, that quality. We do so as well as we can. Afterwards a simple test or formative evaluation will show whether we have reached our goal or not. A fourth example is the management of a company or service body. When the profits or production are disappointing we decide to work harder. The manager or head of a department will determine such things. A fifth example is a student who enters a course on purpose in order to learn some thing and to pass an exam (Min, Vos, Kommers, Van Dijkum, 1998). If he finds that he does not understand the subject he will work harder. If he thinks - for one reason or another - that he knows the subject sufficiently he will stop studying and take the exam. The result are his feedback. Then it will be clear whether the measured value is identical to the desired value.
In all these examples someone sets himself 'a target' or he makes a decision. Usually it is about the target to be achieved. The controlling device says that, from a specific moment, goal A should not be endeavoured, e.g. doing nothing, but goal B. This phenomena of decision making and setting targets we will call the 'set point' here for the 'system'; actually the set point for the primary process: the factory starts to work; the runner starts running; the car begins to drive; the service company will do something; the designer will make his first prototype. In order to control processes such as these you always need 'goals' and at least a feedback mechanism, for you need to know whether you have achieved your target.
Around 1994, there was a conference in Enschede on the campus of the University of Twente that had for its theme the question: 'is designing a science or not'. In 1997 there was another conference about 'Design Methodologies and the Social and Behavioral Science Professions'. The latter gave the impetus to write this paper. It was a conference about the foundations of designing within the social sciences organised by the project leaders: A. Rip, Tj. Plomp and J. Moonen. The project of which this conference formed a part began in 1995 and was financed by the University of Twente. It had to bridge the gap between designers from a large number of disciplines within the social sciences. Several views on design models were generated and some bottlenecks were recognised. Finally Moonen came in 1998 with a very complex model about designing. The model looks rather impractical. It does not provide an insight into the dynamics of designing; but it does shed some light on the successive steps in a design process (Moonen, 1998). But that is in fact still too much like a recipe.
On March 27 1997, an article was published in the NRC/Handelsblad titled: 'Students in the fog' by J. Kuijpers. This was the second reason to write this paper. When talking to company trainers who had similar problems, the author posed questions such as: 'how do you deal with goals and feedback?' The drift of this analysis being that without goals and without evaluation point a lot of courses are rather happy-go-lucky. One might wonder whether students are aware that these might be poor courses. Company trainers know better than anyone else that courses which do not offer the students a goal or where there is no evaluation afterwards discrepancies will arise between the desired and the achieved goal. Therefore this article will be about setting a goal, forms of feedback and comparing two situations. It will be a search for points that designing for instance a learning tool, a course, a curriculum as a product, have in common. But we can also take a closer look at products such as a plan for a campaign or an organizational advice as design products. This article wants to contribute to a good understanding of the primary process, viz. setting goals. One should realize that one should continue until the final goal has really been achieved. Otherwise one will never achieve quality and comparisons will not be possible.
All the examples mentioned above illustrate how people in educational science realize the importance of finding out how designing -dynamically seen - works. In this paper it is stated that control engineering can contribute in finding good models for designing. It even states that control engineering can not only supply those think models, but it will also supply models that can be of use to more than just designing.
Control Engineering II
Control systems have their own characteristics, such as a certain speed in reaction and /or a 'time delay'. The speed of reaction is called 'time constant'. The time required for a result - forward - is called 'time delay'. Time delay in a system, combined with the wrong time constant or a wrong goal, can cause instability in a controlled system (Min, 1998). This article does not take that discussion any further.
measured level; difference; goal; feedback; result.
Figure 2. This is a picture of a general feedback system also called feedback system. This system is of importance from the point of view of control engineering. We can now state how much the difference is between the desired and the measured value. The difference in a feedback system always returns to zero. The curve that illustrates this occurs everywhere in life: in social sciences, psychology, physics etc.
If there is no proper feedback system or there are no clear signals of the primary process to the decision maker, it will be impossible for the decision maker to control things well. For, the primary process can do as it pleases and consequently it can not possibly deliver a good 'product'. We call a bad 'product' 'poor quality' here. Jordan called this form of management and control 'quality control' (Jordan, 1962).
Interruptions Desired Output Z Value G
Figure 3. Here you see a classical control circuit, but differently organized (drawn) as compared to Figure 1.
In many fields of science, thinking about 'quality' has not yet been given the priority which it deserves. This is probably due to the fact that notions such as 'product', 'quality' and last but not least the word 'control engineering' have acquired all sorts of negative associations. The world of service companies needed thirty years to dispose the very businesslike word (and here therefore technical) 'product' of its physical load.
A designer can not make a design without a proper plan. A designer can not assess whether his product is 'finished' without proper feedback. For what measuring rod will you use and what is the standard? Without a goal, a driver can not drive his car (goal). A driver can not drive to the desired destination (feedback) without using his eyes. How does one compare the actual, achieved and measured result with the desired result (goal)? You need something to compare it to, (a 'comparator'). This element is clearly distinguishable in Figure 2.
Figure 4. This is Juran's Quality Control System. The sensor can clearly be seen, an effec tor and a linear process. Then there is the 'set-point' part and the 'comparator'. (First published by Juran, Planning and control; 1954)
The OKT model has a feedback loop in which the evaluation (measuring) is the most important part. This is no coincidence. For if you include an evaluation point - however small or simple - you protect yourself against risks. In a system without a feedback such as a feed-forward- system there are almost always problems. The quality of the result can not be checked. If the quality is measured and there is feedback, the system will adjust until the result and / or prod uct is OK. See the feedback-loop in the OKT-model in Figure 8 and the literature about the theory of Quality Control of a.o. Juran, 1962 (first print) and Bush & Mosteller, 1955. Feed-forward systems, systems without feedback-mechanism are impossible in practice if you want to achieve a previously set goal. Let alone if there are all kinds of interruptions in the process or when setbacks occur.
aim (or goal) , desired level, time, desired difference and actual level, product quality, time, actual level, time.
Figure 5a. The three most important curves as a time function. The top curve: the 'goal' which one sets oneself in the beginning on a specific moment. The bottom curve: the level of the 'quality of a product' increases in the course of time - for some reason or other -. Eventually the product will meet the expectations more and more. In order to achieve that quality time is needed. Time in this figure can be measured in minutes, hours, days or years. The growing speed depends besides on the system's 'time constant'. The middle curve: the difference between the desired value and the actual - measured - value; and its highly characteristic development in the course of time.
This article actually deals with what Juran called 'Quality Control' in 1962 (Juran, 1962). This system-thinking of Juran's is - in my opinion - a superb example of control engineering. In his feedback system (see the enclosed) the quality of a product or a process can always be achieved. One should plan properly. A norm should be set. That will be called the 'set point' or desired value -the desired quality- . By means of a (proper) control. i.e. a control in respect of the difference between the desired value (set point) and the measured value (result), the long-term result -whatever happens- will be equal to the desired value. Juran starts from three important quantities for quality control: 1.planning, 2. control, 3. (continuous) improvement. Controls should take place during all stages of a production process. Then you will end up with a stable quality and changes in quality will not occur.
Figure 5b. The interactive simulation model. Here you can start - by clicking - the interactive model as described in the text. Case 1: If you change the 'target' ('IN') you see the outcome. Stop if the target is reached.
Figure 5c. A screendump (2) with the output of our analogon: our model of .... This screendump shows that - with .... something and ...
Decision making
Every feedback system has an input and an output. Input is a decision to go and do something; the goal. One decided to go from level A to level B. The management of a company can decide to produce 200 cars a day instead of 100. A student can decide to attend three lectures instead of two or someone can decide to walk 10 km. an hour instead of 5. Figure 2 shows some of those situations. Characteristics of the control systems discussed here is the sudden transition from value a to a different value: b or c. It is usually an acute decision or a change in target which is made from one moment to the next. Gradual changes of target are more complicated, but actually gradual target changes consist of small, step by step changes of the target.
Output depends primarily on the characteristics in the 'forward direction' or 'controlled system' (B.S.). A system without a feedback-loop has then become a feed-forward system. The behav iour of the 'controlled system' (B.S.) determines the behaviour of the entire system (including feedback). We call that behaviour of the 'controlled system' (here) the 'intrinsic behaviour' of a system. In the book by Kramer and De Smit (1991) the 'reinforcement' K and the 'time delay' tau are seen as the most important characteristics of the controlled system. A system with a feedback-loop behaves differently, control engineering can predict how and what the behaviour is in respect of the quantities K and tau. The behaviour of a feedback system in time however, is somehow determined by the quantities of the forward system. The time constant of the feedback system for instance is thus fixed.
The output of a feedback system has five characteristic types of responses as compared to a step by step input. Kramer and De Smit describe this in their book on page 74. They are: 1. fast (or slowly) increasing from the starting value a and afterwards slowly arriving at the end value b; 2. fast (or slowly) increasing to a value larger than b, but going back and finally after one or two overshoot or undershoot reactions arriving at the end value b; 3. very slowly increasing from the starting value a and then faster to arrive slowly at the end value b; 4. fast (or slowly) increasing to a maximum value, but finally returning to the starting value a; 5. an amplifying phenomenon with an unclear but (very) high final value that does not amount to value a anymore.
Figure 6. A few fundamentally different types of responses
Figure 6 shows the three main responses: a so-called 'first order' control system; a so-called 'second order' control system and a deviating control system (with delay). The behaviour of the output will tell a specialist almost everything that is of importance in a control system. The output reveals almost everything, both of the B. S. part and of the B.O. part. With this, a specialist can determine the so-called 'control-characteristic'. The nature of the 'control characteristic the determines the way one handles such a system and how to control such systems or keep them stable. Stability is essential in control engineering. The characteristics of an entire feedback system are fixed once you know the characteristics of the 'controlled system' (B.S.). Then one can determine in the sense of control engineering (scientifically therefore) when a feedback system becomes unstable automatically or when - and under what circum stances - a certain 'decision' can become unstable for instance b becomes to large in respect of a and in respect of other properties of the system. When K is very large and tau reaches critical values, the system that used to be stable becomes unstable.
In Figure 3 and 5 you can see the characteristic development of (first order) control systems. Control systems without overshoot can be defined as first order control systems; systems with an overshoot are usually second order control systems or higher.
Figure 7. In this figure you can see how managers make an effort (and have done so) when they found (at the time) that the measured value of their ideal was had come to a halt. Every time the value of this variable came to a halt (and the model reached a steady state) one would put in more effort. This pattern is highly characteristic and occurs everywhere in control engineering in systems with feedback mechanisms. According to : McAfee & McMillian, Analysing the airwaves Auction, J. of Economic Perspectives 10:1 (1996) pp. 159-175.
In figure ... one can see the ideal theoretical development of (first order) control systems and in figure .... the development of a relatively random other (first order) control system. Most characteristic of first order control systems is the accumulating 'result' and consequently the largest possible difference at the beginning between 'goal' and 'result'. That difference only grows slower in the course of time and finally it will be almost nil. Figure ... illustrates very clearly that 'decision makers' would always make new efforts to try and improve the result at those moments when the 'measured result' came to a halt, and the 'output curve' would become equal. Between the starting moment 0 and 12 one would give fewer and fewer 'inputs'; be tween moment 12 and 64 one would give fewer and fewer inputs and between moment 52 and 112 also. Apparently output does not decrease automatically so one should continue to feed this system. Or you should accept the achieved level. Without effort (from outside) the 'output' of this system (apparently) does not increase (any further). This example from the 'Journal of Economic Perspectives' was chosen because it is so exemplary for a first order control system in which you can see 'accumulation'. This form of control and phenomena in which accumula tion plays a part occur frequently.
Accumulating systems
Feedback systems are in general non-linear control systems. Yet, feedback stems are linear for a minor part; for instance when it is about two or three (small) changes on the input-side. The output-side does show linear behaviour on the output-side after a certain typical time. When turning a steering wheel the vehicle or boat usually will turn left when you have turned the wheel two or three times to the left -more than when you turn just once- .This points to the fact that many systems are partially linear. The model of learning or designing that is described here shows clearly that when you make twice as much effort you do not by definition get a result that is twice as good. On the contrary. In the result curves versus an 'effort' one can see per time element that when the level is nearly achieved a major effort is usually required to achieve a level that is a little higher. In principle, all this can be derived from figure ... Min described this non-linear phenomenon already in 1986, in his first Dutch book (Min, 1986). In 20% of the project time 80% of the goal is usually achieved, but after that 80% of the project time is required to really achieve a goal finally, 100% therefore.
The learning model set up by us also knows this accumulating behaviour. Many models show accumulation: e.g. the model for designing, but also models for organization management.
Designing
Designing is an occupation in which one has a specific plan and enters a process to ultimately evaluate the quality of the product. Evaluation means the measuring of the product quality in one way or another. The consideration whether something meets the expectations is a second and is usually left to others. Designing does not seem as dynamic as controlling, yet the design ing process is a controlled system. There is a 'target'. There is a 'process'. There is an 'evalua tion' and a 'decision process'. Finally the light will show green or red; go or no go.
If we see designing within social sciences largely as a process as described by Plomp et al. (1992), then it is striking that in spite of the huge amount of criticism which that model has received through the years, it is still seen as a good starting point by everyone. This certainly applies to inexperienced designers and it is therefore ideal for students during their study. Actually there is no simpler alternative. Only the 'rapid prototyping' deviates. There the goal is continually adapted during the design stage and the realization of the product. This can be compared to what is explained in figure ....: you set yourself a goal which is always different and higher and that is what you try to achieve. But when one continues this line of thought , then Plomp's OKT-model is even practicable in the 'rapid prototyping' situation.
Figure 8. The OKT-model of Plomp et al. (above). The feedback loop is clearly visible. The evaluation moment is essential to protect the 'quality' of the 'product' . That is actually the comparator. Without the feedback loop, the product could never be made to match the desired value (in respect of 'quality'). If we turn the OKT-model 90 degrees we actually see an ordinary control system with all the characteristics as described in the text.
If you turn the OKT-model 90 degrees to the left, it is a feedback system with a 'measuring moment' (the evaluation) and a feedback loop that is repeated until the measured value is equal to the desired value (on the right). A designer also wants zero difference between the desired value and the measured value. The designer will go on polishing his product or solution until the desired result ('goal') has been achieved. Only then will the designer stop. This is clearly visible in figure .... The 'primary process' (B.S.) in the OKT-model is to see the realization of the product. The 'control device' (B.O.) is the goal which the designer sets himself. This goal is usually the result of earlier study. The difference between the 'measured value' and the 'goal' is compared together during the evaluation. If the difference, the 'error' is zero/nil , the designer can stop polishing and the product is finished.
Within educational science little research has always been done into the drawing up of deterministic models which can establish and copy phenomena as they occur in designing. A lot of research is done into the methodology of designing, but these result in recipe like products and designing rules. However, we do not want to go into that here, in this article.
Figure 9. The heart of the proposed control system runs on a PC. The transfer function (B.S.) in this model has been kept as simple as possible. The B.S. will go on with what it has been told to do until OUT is equal to IN. That is, until e=0. This working prototype was realised by Min and for the present it has been named 'FEEDBACK version 1.0x' (Min, 1999). In this screendump one can see very clearly that the goal of the 'controller' was to take the system from level '5' to level '10' and the difference between the mea sured value (9.4) and the desired value (10.0) is almost nil (0.840). Therefore the goal has almost been achieved. The model indicates everything in timed graphics on the screen.
Results
In order to make one thing and another easier to understand. Min built a number of models which he tested in simulation programmes. In figures 6, 7a and 7b the programmes 'LEARN ING', 'DIFFUSION' and 'PROCESS' can be seen. All these simulations are based on the above described first order control system. They are the pre-prototypes. The cohesion between these three prototypes is that all these programmes are based on the here described control mecha nism of 'Quality Control' by Juran. The learning model was described earlier (Min, Vos, Kommers and v. Dijkum, 1999). The programme DIFFUSION is the so-called broadcast model of ......., described by Vos (Vos & Min, 199..) The latest programme, the pre- prototype PROCESS, was recently developed by Min in order to make visible that these models can be excellent 'think models' in respect of how a land or business is ruled or managed.
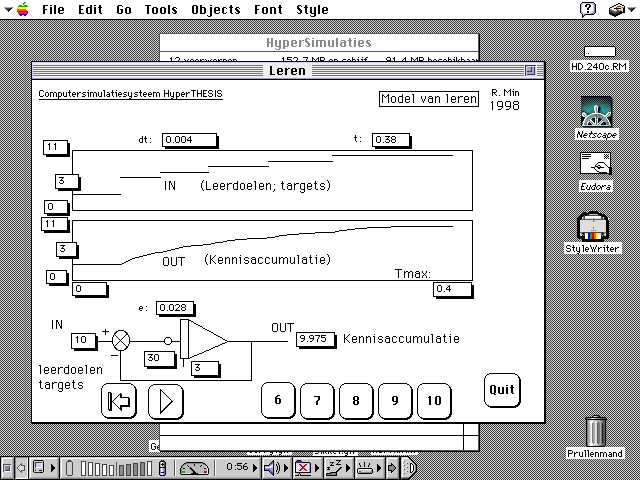
Figure 10. A model for knowledge accumulation. The programme LEARNING, version 2. In this simulation programme in which the model for learning has been applied, you can see how pupils can set themselves a number of goals. The a certain level of knowl edge will be achieved. One starts on level 3 and chooses goal (or level) 6,7,8,9 or 10. In this example one has chosen goal 5 at the moment in time t=0 and on t=0.1 on e has chosen goal 9. (The starting level of the student was 3.) You can see that the student reaches the levels after a certain time. (Min, Kommers, Vos and Van Dijkum, 1999).
Network of linked cells.
Figure 11. Here you can see how a message spreads over a population 'by itself' -through diffusion-. The programme DIFFUSION (Min, 1998) is based on the broadcast model of ....
A company with three levels or the control mechanisms of a country: the government, province and municipality
Figure 12. Here you can see how a decision can be taken at macro level; on meso and on micro level. This is the PROCESS programme (Min, 1998). With this programme one can see how a decision can compete with a decision which has been taken on another level.
With the programme LEARNING you can see how the goal which a student has set himself can be achieved. Eventually one will reach the desired knowledge level. You start on a certain level and choose a goal that lies further away. In the example you can see that the student actually reaches the levels which he was aiming for after a certain period of time. (Min, Kommers, Vos and Van Dijkum 1998).
With the programme DIFFUSION (Min, 1998) you can see how a message spreads through a population through the mechanism of diffusion. The programme is based on the 'broadcast model' (Vos & Min, 2000).
With the programme PROCESS (Min, 1998)you can see how one can take decisions at three different levels: on macro level, meso level and micro level. The programme has a visual output that shows where the evaluation takes place. This programme shows both dynamically and visually how a decision at a certain level competes with a decision at a different level.
Discussion
Due to the fact that these models are based on dynamic models and that the programmes in question also have all kinds of visual output, the underlying phenomenon can be made utterly clear. The user - whether he is an outsider or a professional - will get a proper and relatively reliable insight into a phenomenon. We are still working on better designed and shaped programmes. It is however obvious that without such a simulation programme that educational goal would be much harder to achieve. Later, we intend to show even better which similarities all these approaches, models and programmes have. For the present we would like to make our opinions and findings public. If we put it beside the idea that schemes (such as Plomp's) are actually nothing but feedback systems which behave in accordance with the control engineering theories - and we prove this - then our approach should be taken seriously.
Figure 13. Here you see a functional diagram, in which the main assignments or func tions of Quality Control have been put, the inspection, control and quality guarantee (in respect of the finished product). (First published by Juran, Planning and Control; 1954).
An educational solution for an educational problem, an educational product always has a 'measuring moment' somewhere (the evaluation) and a feedback loop. This loop is passed so often until the measured value is the same as the desired value (b). That is what a designer aims for.
We have tried to show that the main functions from Juran's Quality Control model ( such as inspection, control and the quality guarantee in respect of the finished product) were and are a good starting point for a wide discussion on model formation about these subjects from the social sciences.
Figure 8 shows that designing is principally a cyclical process for which a final goal and feedback are essential items. The above mentioned model for designing provides an even better insight into what designing is really like, and at the same time it provides information about the dynamics of the design cycle. The model which we propose here is therefore an analogon for designing.
The writers hope that they have contributed with this article and the prototypes described here, to the confusion of tongues which is typical for this type of phenomena.
Conclusions
The models need lots of adjustment. There will be plenty of comments. This we shall include in better models or concepts. The model is still in its earliest stage, but the concept has been laid down for discussion. Many details will need elaboration and further argumentation. The time constants will amongst others need further study. The models should be tested to the time scale in real processes - particularly at this point-. Further research should then make clear whether this model can offer a plausible (quantitative) explanation for this type of accumulating phenomena such as 'learning', 'communication', 'design' and 'control'. Phenomena which are so important to understand particularly in cohesion.
References
Juran (1962, first version)
Quality Control. MIT, Cambridge.
Min, F.B.M. (1996)
Parallelism in working-, learning- and doing-environments; The Parallel Instruction Theory for Coaching in Open Learning Environments for Simulation; Proceedings of EuroMedia 96; Telematics in a multimedia environment, dec. 19-21, 1996; A publication of the Society for Computer Simulation International (SCS) (Eds. A. Verbraeck & P. Geril)
Min, F.B.M. (1995)
Simulation Technology & Parallelism in Learning Environments; Methods, Concepts, Models and Systems. Publisher: Academic Book Center, De Lier. ISBN 90-5478-036-3
Min, F.B.M. (1994)
Parallelism in open learning and working environments. Britsh Journal of Educational Technology, Article; Vol. 25, No. 2, pp. 108-112. ISSN 0007-1013.
Min, F.B.M., (1992)
Parallel Instruction, a theory for Educational Computer Simulation. Interactive Learning Intern., Vol. 8, no. 3, 177-183.
Min, F.B.M., H. Vos, P. Kommers and C. van Dijkum (2001)
A concept model for learning; An attempt to define a proper relations scheme between instruction, learning and to establish the dynamics of learning in relation to modern political concepts as study-ability. (In press.) On internet:
http://WWW.TO.UTWENTE.NL/prj/min/papers/Learning.htm
Spada, H. & W.F. Kempf (Eds.) (1977)
Structural Models of Thinking and Learning. Proceedings of the 7th IPN Symposium on Formalized Theories of Thinking and Learning and their implications for science Instruction. Hans Huber Publ., Vienna.
Vos, H. & Min, R, (1997)
Systeembenaderingen in de onderwijskunde (System approach in Educational Science) (courses 1997/98) (in Dutch). Reader, University of Twente, Enschede.
Vos, H. (1997)
Methodenleer (Methodology) (courses 1997/98) (in Dutch). Reader, University of Twente, Enschede.
